Features/Compare

Rank your options before you commit capital.

UnlockLand puts every scheme and every site next to each other on the metrics that matter — cost, returns, risk, and timeline — so the strongest option is obvious and the decision is yours to make, not to guess.

Start For Free Book a Demo

The compare stage — where many options become one decision.
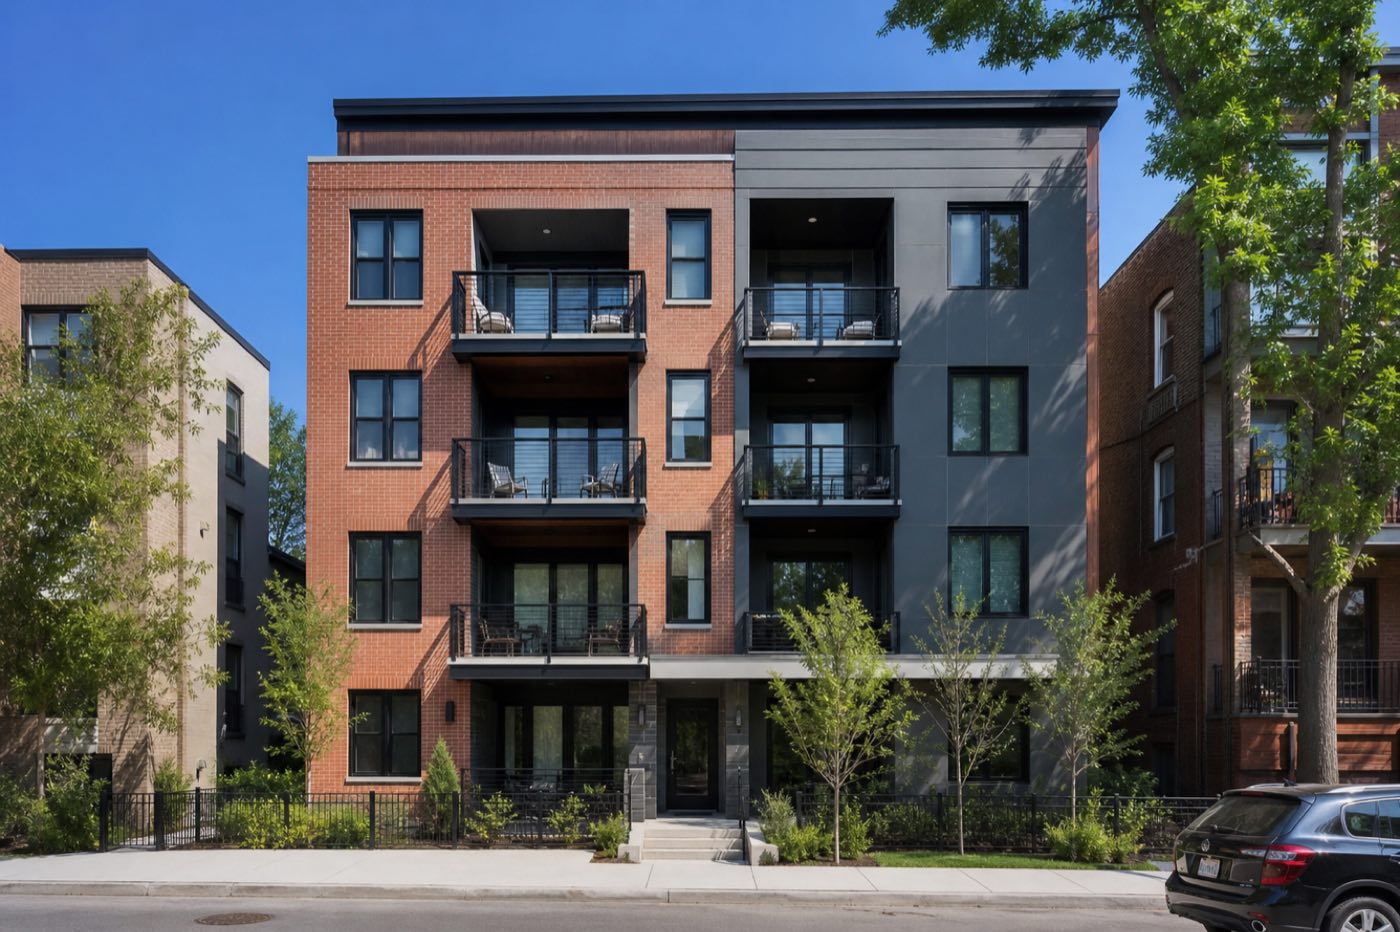
Completed multiplex residential building, one of several schemes weighed against each other
Three schemes, one site

Every option deserves the same yardstick before capital commits.

Side-by-Side · Riyadh Sedra Ext (Ph 4–6) Sorted by IRR ▾
Metric
AI recommended
Scheme B
Green Core Community
Option
Scheme A
Eco Spine Community
Option
Scheme C
Dammam Grand Blvd
Units
186
172
204
GFA (sf)
214,800
198,400
231,600
Build cost
$47.2M
$44.1M
$53.8M
IRR 5-yr
22.6%BEST
19.2%
21.4%
Net profit
$521MBEST
$437M
$486M
Payback
4.8 yrsBEST
6.0 yrs
5.1 yrs
Risk flags
1 low
2 med
3 high
Scheme B leads on IRR, profit, and payback with the lowest risk — recommended as highest and best use. Lock winner

Illustrative interface — three schemes on identical assumptions, best value highlighted on every row.

One view, every option, the same yardstick

Side-by-Side lines up your schemes — or competing sites — in a single comparison built on the same assumptions. No more reconciling spreadsheets that were each built differently. See where one option wins on returns but loses on risk, and rank them on the trade-off that fits your mandate.

Aligned metrics

Cost, profit, margin, yield, and IRR for every option, computed on identical assumptions so the comparison is honest.

Risk & timeline

Feasibility flags and delivery timelines sit beside the returns, so a higher number never hides a heavier risk.

Clear ranking

Sort by the metric that matters most to this deal and the leading option rises to the top — with the gaps made visible.

How it works

STEP 1

Add the contenders

Pull in the schemes you analyzed — or competing sites — into one comparison. Each carries its own cost, returns, risk, and timeline.

STEP 2

Align the assumptions

UnlockLand normalizes every option to the same basis, so differences in the numbers come from the schemes themselves, not from inconsistent inputs.

STEP 3

Rank and decide

Sort by margin, IRR, risk, or time-to-deliver. The strongest option surfaces, with the trade-offs laid bare for your investment committee.

See the trade-offs, not just the winner

A higher return often hides a heavier risk or a longer timeline. The trade-off view shows where each scheme is strong and where it pays for that strength.

Trade-off profile Scheme B Scheme A Scheme C
Returns Profit Low risk Speed Yield Cost eff.
Weighted ranking
Returns 40% · Risk 30% · Speed 30%
1 Scheme B Green Core 92
2 Scheme C Dammam Blvd 78
3 Scheme A Eco Spine 71
Re-weight the priorities and the ranking re-sorts instantly.

What goes in, what comes out

You provide
  • Two or more analyzed schemes or sites
  • The metric that matters most for this deal
  • Optional: weighting across return, risk & timeline
UnlockLand returns
  • A single aligned comparison table
  • Cost, profit, margin, yield & IRR per option
  • Risk flags and delivery timeline side by side
  • A ranked shortlist ready for a decision

Where it fits in the workflow

Side-by-Side takes the returns you computed for each scheme and turns a shortlist into a ranking. From here, settle on the highest and best use, then lock the winner into a full financial model.

Before
Return Analysis
The metrics each option is ranked on.
Next
Highest & Best Use
Find the scheme that maximizes value.
Platform
See the full workflow
How comparison drives decisions.

Ready to compare plans? See pricing.

Put your options side by side. Pick the winner.

Start free and compare your first set of schemes in minutes — no credit card required.